We Fixed 6 Popular Indicators. 2 Worked, 1 Got Worse
Six indicators, one question
Our backtests keep showing that the indicators YouTube loves mostly lose money once you add fees. Fair enough. The obvious follow-up is whether they can be fixed, or whether they're just broken.
So we took six of them and added the boring stuff experienced traders already use: trade with the bigger trend, skip chop, use a stop. No parameter tuning, no fancy new indicators. Then we ran plain vs fixed on three years of BTC, ETH and SOL, 1h and 4h, 0.05% fee per side, 1x.
Short version: two of them got genuinely good, three got less bad, and one got worse because we "fixed" it.
The scoreboard
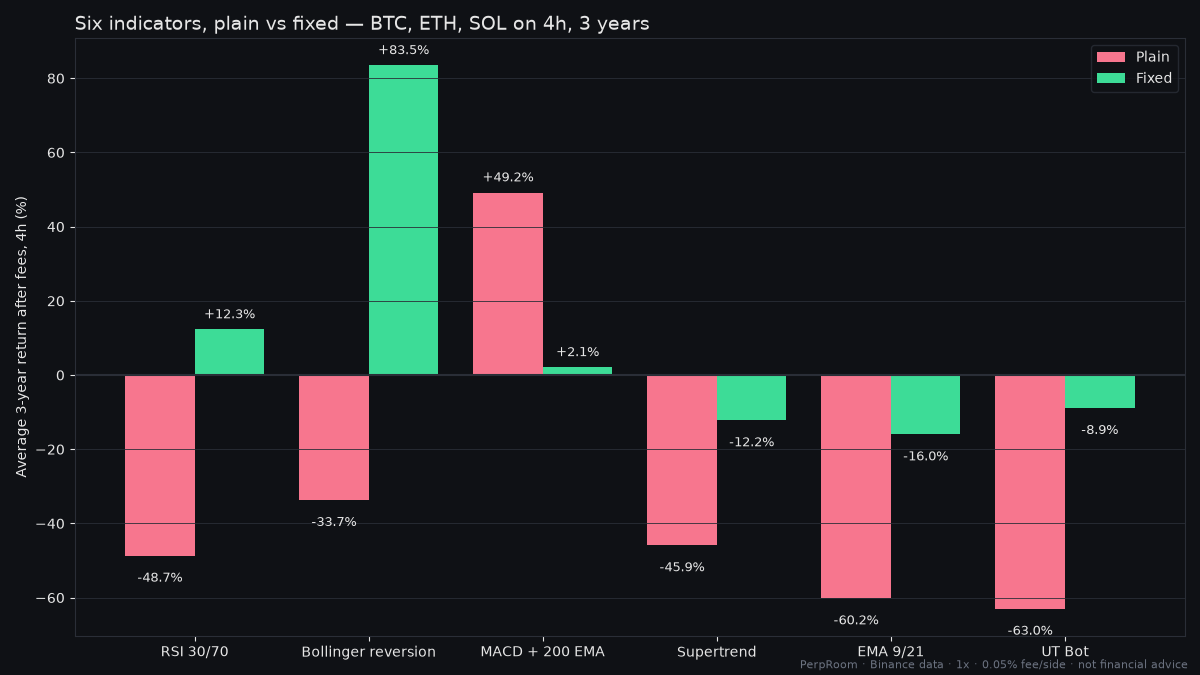
Average return after fees over three years. "4h" is the average of BTC, ETH and SOL on 4h. "All runs" adds the 1h runs too.
| Indicator | What we added | Plain, 4h | Fixed, 4h | Plain, all runs | Fixed, all runs |
|---|---|---|---|---|---|
| Bollinger reversion | 200 EMA filter, 2 ATR stop | -33.7% | +83.5% | -53.7% | +35.3% |
| RSI 30/70 | 200 EMA filter, 2 ATR stop | -48.7% | +12.3% | -58.6% | -0.1% |
| UT Bot | 200 EMA filter, ADX 25 filter | -63.0% | -8.9% | -76.4% | -39.6% |
| Supertrend | ADX 25 filter | -45.9% | -12.2% | -62.1% | -39.0% |
| EMA 9/21 | 200 EMA, ADX 25, 2.5 ATR stop | -60.2% | -16.0% | -61.7% | -26.6% |
| MACD + 200 EMA | 2 ATR stop, 3 ATR target | +49.2% | +2.1% | -4.4% | -30.1% |
The winners: mean reversion plus a trend filter
Bollinger and RSI are both "it's stretched, it'll snap back" indicators. Their problem was never the signal. It was taking that signal against a trend and having no exit when the snap back didn't come.
Only buying dips above the 200 EMA, only shorting rips below it, and cutting the trade at 2 ATR fixed both. Bollinger went from -33.7% to +83.5% on 4h and made money on all three coins. RSI went from -48.7% to +12.3%.
We wrote both up in full, with the unseen-year test, every run, and Pine scripts:
- Two Rules Took Bollinger From -19.9% to +151% on SOL
- Plain RSI Lost 46.7% on SOL. Two Rules Made It +23.9%
The trend followers: less bad, still bad
UT Bot, Supertrend and EMA 9/21 are trend followers. They flip long and short with the trend and get chopped to pieces when there isn't one.
We tried to keep them out of chop with an ADX filter (only trade when ADX is 25 or above) and, for UT Bot and EMA, a 200 EMA direction filter. It helped across the board. UT Bot on 4h went from -63.0% to -8.9%. On ETH 4h it flipped from -50.9% to +49.6%.
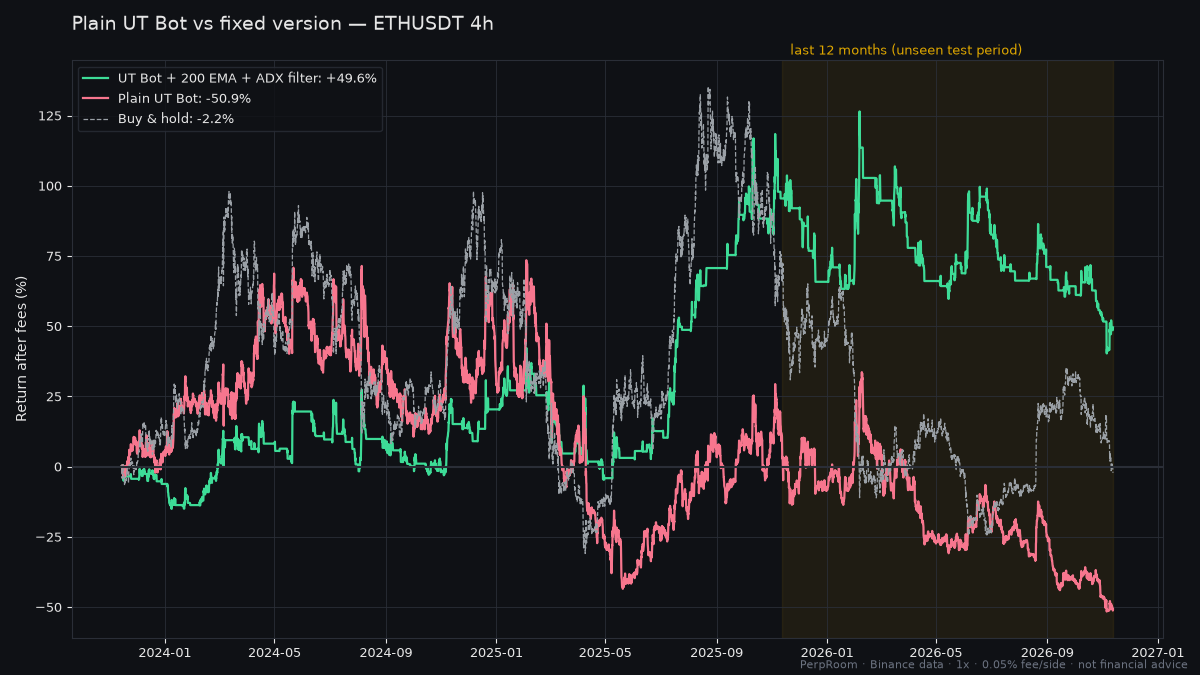
But none of the three finished positive on average, even on 4h. A filter that skips chop also skips the start of a lot of trends, and these systems still trade enough to hand a big slice to fees.
How big? Plain UT Bot on 1h paid an average of 297.2% of starting capital in fees over three years. That's not a typo. It traded so often it paid for the account about three times over. Plain EMA 9/21 on 1h paid 118.9%. If your strategy fires every few hours, the exchange is your most reliable winner.
The one we made worse: MACD
MACD with a 200 EMA filter was the surprise of the batch. Plain, on 4h over three years, it averaged +49.2%, with ETH 4h at +147.0%. That's a lot better than the one-year test we published earlier, which tells you how much a single year can mislead in either direction.
Then we "improved" it with a 2 ATR stop and a 3 ATR take profit, the kind of tidy risk-reward setup every course recommends. ETH 4h went from +147.0% to -8.2%. The 4h average fell to +2.1%.
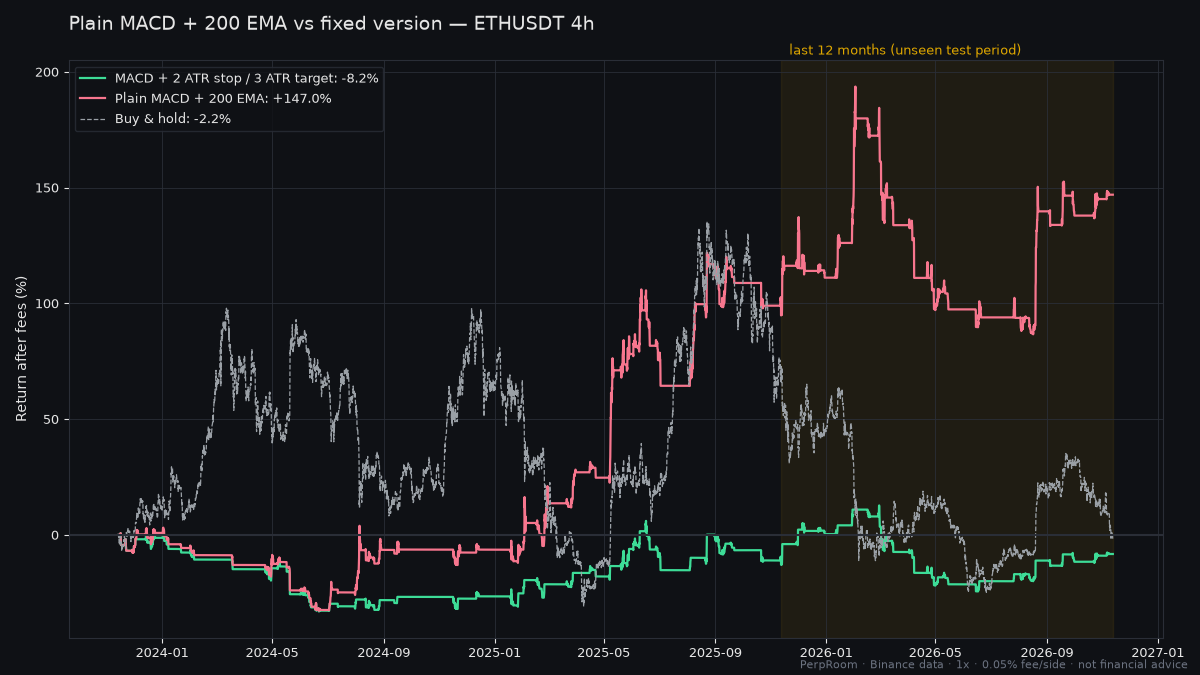
The reason is simple once you see the chart. A trend system makes its money from a handful of huge trades. A fixed 3 ATR target closes those trades early, every time, and you keep all the small losers. Stops help mean reversion. Fixed targets kill trend following.
What this adds up to
Three rules came out of six indicators, and they're more useful than any single setup:
- Fade moves only with the trend. Mean reversion plus a 200 EMA filter was the best thing we tested.
- Trend systems need room. Don't cap them with fixed targets.
- Timeframe decides your fee bill. On 1h almost everything lost after fees, fixed or not. On 4h the same logic had a chance.
The usual honesty
Three years covers one big uptrend and one hard downtrend. Fills are at the candle close, there's no slippage, no funding, and no leverage. Live results come in under backtests. Leverage turns a -20% drawdown into a liquidation. Treat all of this as research, not a promise.
FAQ
Which indicator works best for crypto futures? In our test, Bollinger Band mean reversion with a 200 EMA trend filter and a 2 ATR stop on 4h. It averaged +83.5% over three years across BTC, ETH and SOL. The plain version averaged -33.7%.
Do stop losses improve trading strategies? For mean reversion, yes, a lot. For trend following, a fixed take profit hurt badly: MACD + 200 EMA on 4h fell from +49.2% to +2.1% when we added one.
Why do most indicator strategies lose money? Mainly fees from overtrading and trading against the trend. Plain UT Bot on 1h paid 297.2% of starting capital in fees over three years.