Plain RSI Lost 46.7% on SOL. Two Rules Made It +23.9%
Same indicator, two extra rules
Plain RSI 30/70 has been dragged through our backtests already. It wins a lot of trades and still bleeds out, because the winners are small, the losers are huge and there's no stop.
So we asked the obvious next question. If you keep RSI but fix the two things that kill it, does anything change?
It does. On SOL 4h over three years, plain RSI finished at -46.7%. The fixed version finished at +23.9%. Same entries at 30 and 70. Two rules on top.
Before anyone screenshots that and runs off with 20x: it didn't beat just holding SOL (+58.4% over the same stretch), it traded 10 times in three years, and on 1h it still lost money. We'll get to all of that. But the difference between the two versions is the most useful thing we've found so far, and it's not subtle.
The two rules
Plain version, same as our original test:
- RSI(14). Long when it crosses back above 30, short when it crosses back below 70.
- Exit when RSI gets back to 50. No stop.
The fix adds exactly two things:
- Trade with the trend only. Longs only while price is above the 200 EMA. Shorts only while it's below.
- A hard stop. Exit if price closes 2 ATR against you. After a stop, no re-entry until a fresh signal.
That's it. No optimising, no new indicators. The 200 EMA and 2 ATR are about as default as defaults get, and we didn't tune either of them.
How we kept ourselves honest
Three years of Binance data, BTC, ETH and SOL, 1h and 4h, 0.05% fee per side, 1x, signals and stops checked at candle close.
We split it. The first two years (2023-11-13 to 2025-11-12) is where you'd normally go hunting for settings that look good. The last twelve months (2025-11-12 to 2026-11-12) is the part that matters: data the rules had never been judged on. If something only works in the first chunk, it's curve fit and we bin it.
Nothing was tuned on either chunk. We wrote the rules, ran them once, and this is what came out.
Last 12 months, side by side
This is the unseen period. Every run, plain vs fixed, after fees:
| Run | Plain: trades | Plain: net | Plain: max DD | Fixed: trades | Fixed: net | Fixed: max DD | Buy & hold |
|---|---|---|---|---|---|---|---|
| BTC 1h | 136 | -4.2% | -29.4% | 16 | +4.6% | -5.8% | -29.5% |
| BTC 4h | 29 | -38.7% | -40.1% | 5 | +2.2% | -2.7% | -29.2% |
| ETH 1h | 129 | -34.7% | -44.2% | 23 | -14.9% | -20.3% | -41.5% |
| ETH 4h | 33 | -9.9% | -37.1% | 6 | +6.6% | -7.0% | -41.0% |
| SOL 1h | 130 | -22.4% | -47.0% | 15 | -0.9% | -9.1% | -46.9% |
| SOL 4h | 29 | -35.7% | -42.5% | 5 | +11.2% | -3.5% | -46.6% |
Plain RSI lost money on all six. The fixed version made money on 4 of 6. Average max drawdown went from -40.1% to -8.1%.
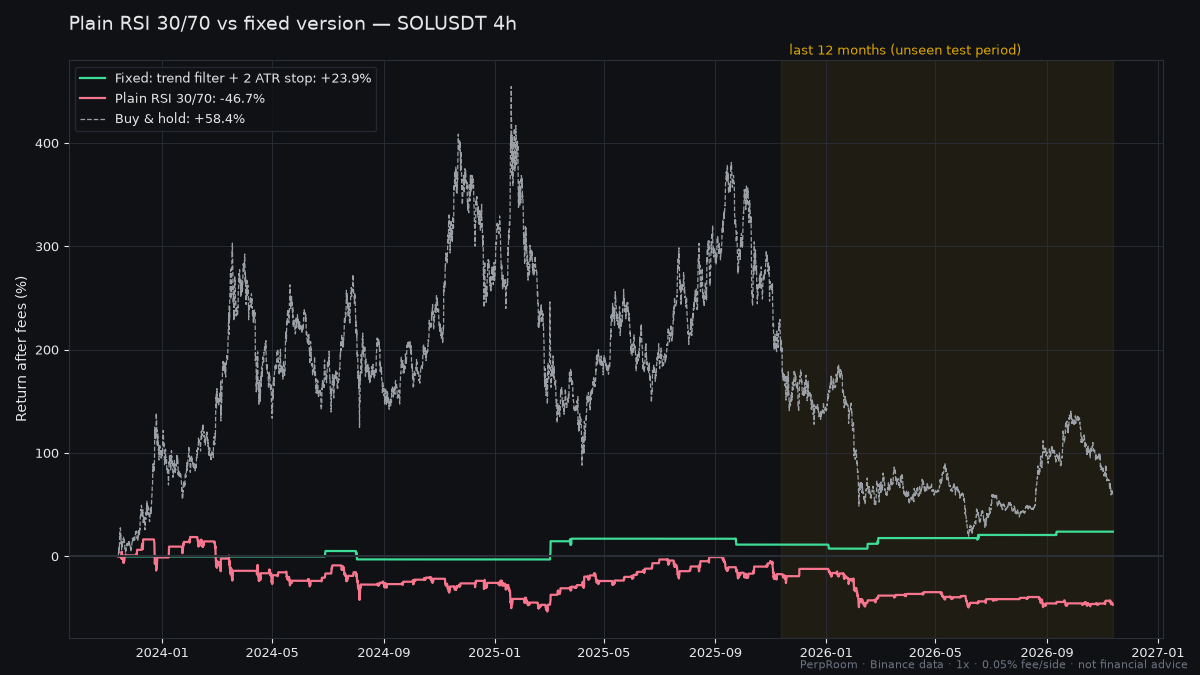
That chart is the whole story in one picture. The red line is plain RSI catching every falling knife SOL threw at it. The green line mostly sits in cash, takes a handful of trades with the trend, and steps up.
Why it works (and it's not magic)
The trend filter stops you fighting the tape. Plain RSI goes long every time SOL gets "oversold" in a downtrend. In a real selloff, oversold just gets more oversold. With the 200 EMA filter you only buy dips when the bigger trend is up, and you only short rips when it's down. Most of the worst trades simply never get taken.
The stop caps the damage. The original problem was payout shape: small wins at RSI 50, open-ended losses with no stop. A 2 ATR stop doesn't make the strategy smarter. It just means one bad trade can't eat ten good ones.
Fewer trades means a smaller fee bill. Over the full three years plain RSI took 1431 trades across the six runs. The fixed version took 199. On 1h, plain RSI paid an average of 38.1% of capital in fees over three years. Fee drag was doing a lot of the killing, and the filter cuts most of it out without trying.
4h is where it held up
Split by timeframe, the picture gets sharper.
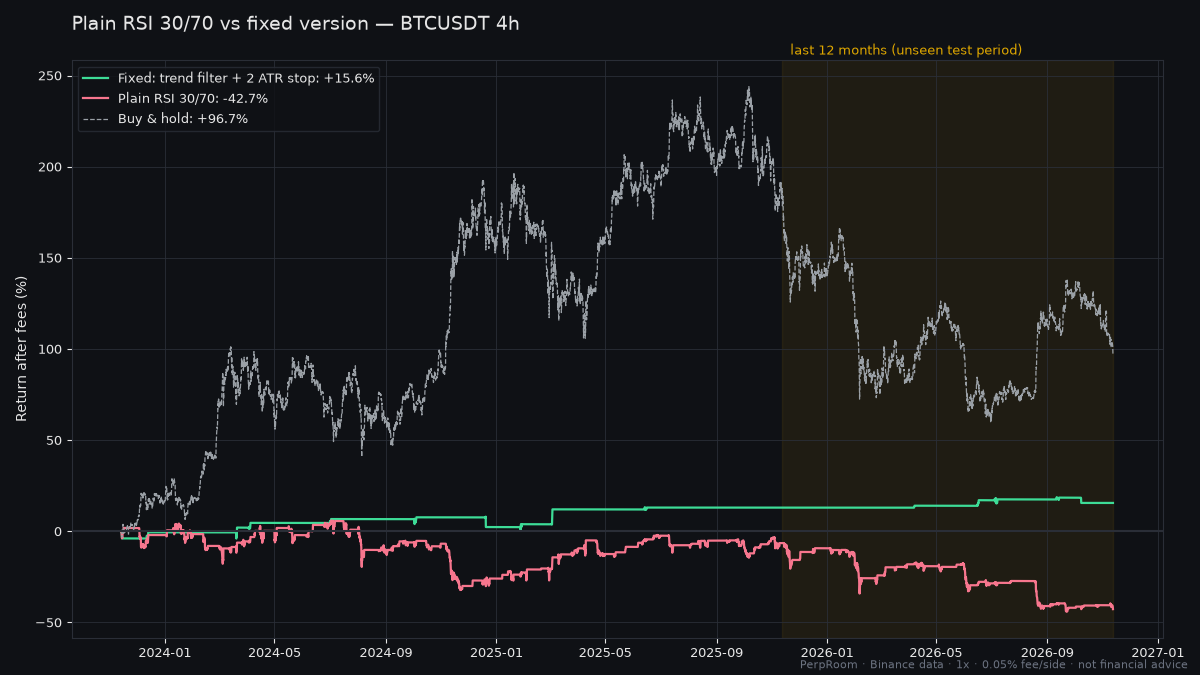
On 4h the fixed version made money in 5 of the 6 period checks (three coins, first two years and last twelve months). Over the full three years: BTC 4h +15.6% with a -6.6% max drawdown, SOL 4h +23.9% with -8.3%, ETH 4h -2.7%.
On 1h it's a different animal. Better than plain RSI everywhere, but still a loser overall: three-year average -12.4% vs -68.6% for plain. ETH 1h is the clearest case, the fix cut the loss from -77.3% to -20.1% and that's still -20.1%.
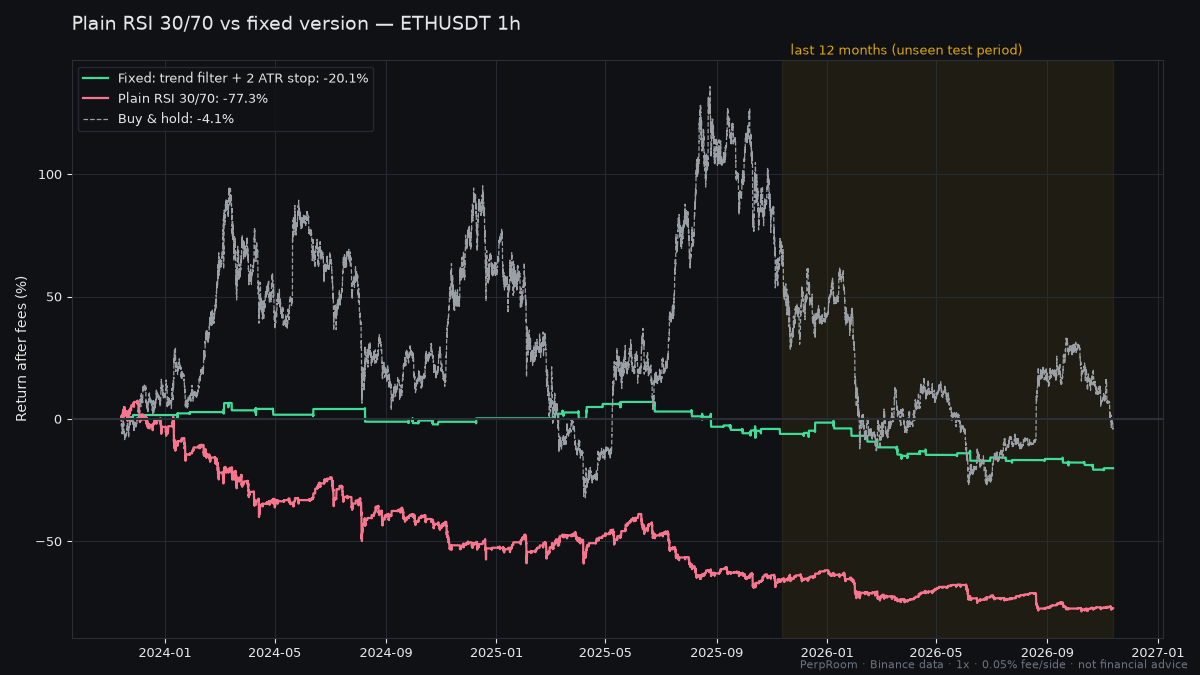
Our read: on 1h there's too much noise around the 200 EMA, the 2 ATR stop gets tagged by normal chop, and you get wicked out of trades that would've worked. On 4h the same rules have room to breathe.
What we're not going to pretend
It didn't beat holding in a bull market. In the first two years buy and hold made between 62.4% and 201.8% depending on the coin. The fixed RSI didn't come close, because it's flat most of the time. Over the full three years it lost to holding in all six runs. This is a way to trade without bleeding, not a way to outrun a bull run.
The 4h sample is tiny. SOL 4h took 10 trades in three years. BTC 4h took 15. Good numbers off 10 trades can be luck. We're showing it because the direction is consistent across coins and periods, not because 10 trades proves anything.
Real fills are worse than this. We check stops at the candle close. A real stop order fills when price touches it, and on a fast wick that can be better or a lot worse. No slippage or funding in here either.
Leverage changes everything. At 1x the worst drawdown in the unseen period was -20.3%. Put 10x on that and you're not looking at a drawdown, you're looking at a liquidation.
Build it on TradingView
Paste this into the Pine Editor, add it to a 4h chart, and set the date range to compare with our numbers. Fees and fills are set to match our test. Expect small differences from data feed and start date.
📈 Paste this into the Pine Editor on TradingView: Open TradingView → Sign up through our link and get a $15 coupon toward a TradingView plan.
//@version=5
strategy("RSI 30/70 + 200 EMA + 2 ATR stop", overlay=false, process_orders_on_close=true,
     commission_type=strategy.commission.percent, commission_value=0.05,
     default_qty_type=strategy.percent_of_equity, default_qty_value=100)

r = ta.rsi(close, 14)
trend = ta.ema(close, 200)
atr = ta.atr(14)
var float stopPx = na

if strategy.position_size == 0 and ta.crossover(r, 30) and close > trend
    strategy.entry("Long", strategy.long)
    stopPx := close - 2 * atr
if strategy.position_size == 0 and ta.crossunder(r, 70) and close < trend
    strategy.entry("Short", strategy.short)
    stopPx := close + 2 * atr

if strategy.position_size > 0 and (r >= 50 or close <= stopPx)
    strategy.close("Long")
if strategy.position_size < 0 and (r <= 50 or close >= stopPx)
    strategy.close("Short")

plot(r, "RSI")
hline(70)
hline(50)
hline(30)
Verdict
If you're going to trade RSI at all, trade this version and not the one on YouTube thumbnails. The two rules took it from losing on every run to a strategy that mostly sits in cash, takes a few trades with the trend and doesn't blow up.
We'd only run it on 4h, small size, no leverage to speak of, and we'd treat the 4h results as promising rather than proven until there are a lot more trades behind them. Next on our list: the same two rules on the other indicators we've tested, to see if "trend filter plus a stop" is the real edge here and RSI is just along for the ride.
FAQ
What's the best RSI setting for crypto? We didn't change the settings at all. RSI(14) at 30/70 stayed the same. What changed the result was only taking trades in the direction of the 200 EMA and using a 2 ATR stop.
Does adding a stop loss to RSI help? In our test, yes, combined with a trend filter. Average max drawdown in the last 12 months fell from -40.1% to -8.1%, and 4 of 6 runs finished in profit against 0 of 6 for plain RSI.
Is RSI better on 1h or 4h? 4h, clearly. On 1h the fixed version still lost an average of 12.4% over three years. On 4h it averaged +12.3%, from a small number of trades.