Two Rules Took Bollinger From -19.9% to +151% on SOL
The worst setup on our list, fixed
Bollinger Band mean reversion was one of the ugliest results we've published. Buy when price closes back inside the lower band, short when it closes back inside the upper band, exit at the middle. Win rates in the 60s, and it lost money on every coin we tried.
Then we bolted on the same two rules that rescued RSI. Nothing new, nothing tuned for Bollinger. Same two rules, copied across.
Over three years on SOL 4h, plain Bollinger reversion finished at -19.9%. The fixed version finished at +151.0%. Holding SOL over the same stretch made +58.4%.
That's the first setup in our testing that beat simply holding the coin. It's also the first one where we had to double-check the code before we believed it. We did. Here's everything.
What changed
Plain version:
- Bollinger Bands (20, 2).
- Long when price closes back above the lower band. Short when it closes back below the upper band.
- Exit at the middle band. No stop.
Fixed version, two additions:
- Trend filter. Longs only while price is above the 200 EMA, shorts only while it's below.
- Hard stop at 2 ATR, checked at the close. After a stop, no re-entry until a fresh signal.
In plain English: you only buy dips in an uptrend and only short rips in a downtrend, and you get out if you're wrong. That's not a secret. It's what most decent discretionary traders already do. The point here is seeing it in numbers.
One thing worth saying up front. We picked these two rules for RSI, before we ever ran them on Bollinger. So this isn't a case of trying fifty filters until one looks good on this indicator.
Testing setup
Three years of Binance data for BTC, ETH and SOL on 1h and 4h. 0.05% fee per side, 1x, everything checked at candle close, no slippage.
We split it the same way as before. First two years (2023-11-13 to 2025-11-12) and the last twelve months (2025-11-12 to 2026-11-12) as an unseen test.
4h: the result that matters
Full three years, 4h, after fees:
| Coin | Plain: net | Plain: max DD | Fixed: trades | Fixed: win rate | Fixed: net | Fixed: max DD | Buy & hold |
|---|---|---|---|---|---|---|---|
| BTC | -38.0% | -50.0% | 94 | 67.0% | +13.7% | -21.3% | +96.7% |
| ETH | -43.3% | -65.4% | 97 | 71.1% | +85.7% | -19.9% | -2.2% |
| SOL | -19.9% | -64.0% | 98 | 76.5% | +151.0% | -23.5% | +58.4% |
All three plain runs lost. All three fixed runs made money, with max drawdowns between -19.9% and -23.5%. On ETH and SOL the fixed version beat holding. On BTC it didn't come close to holding, which tells you something about BTC's last three years more than about the strategy.
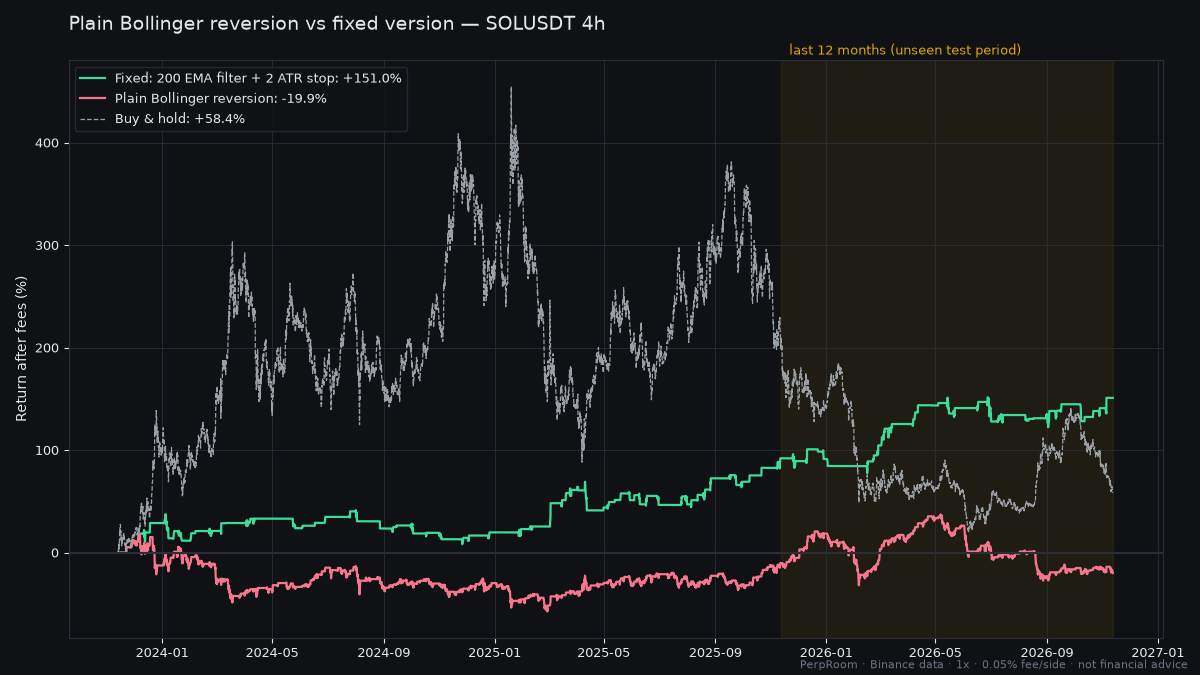
Look at where the green line makes its money. It grinds up in the first two years while SOL trends, and it keeps grinding through the last twelve months while SOL gets cut in half. The trend filter flips it to the short side when price drops below the 200 EMA, and shorting rips into the band in a downtrend worked.
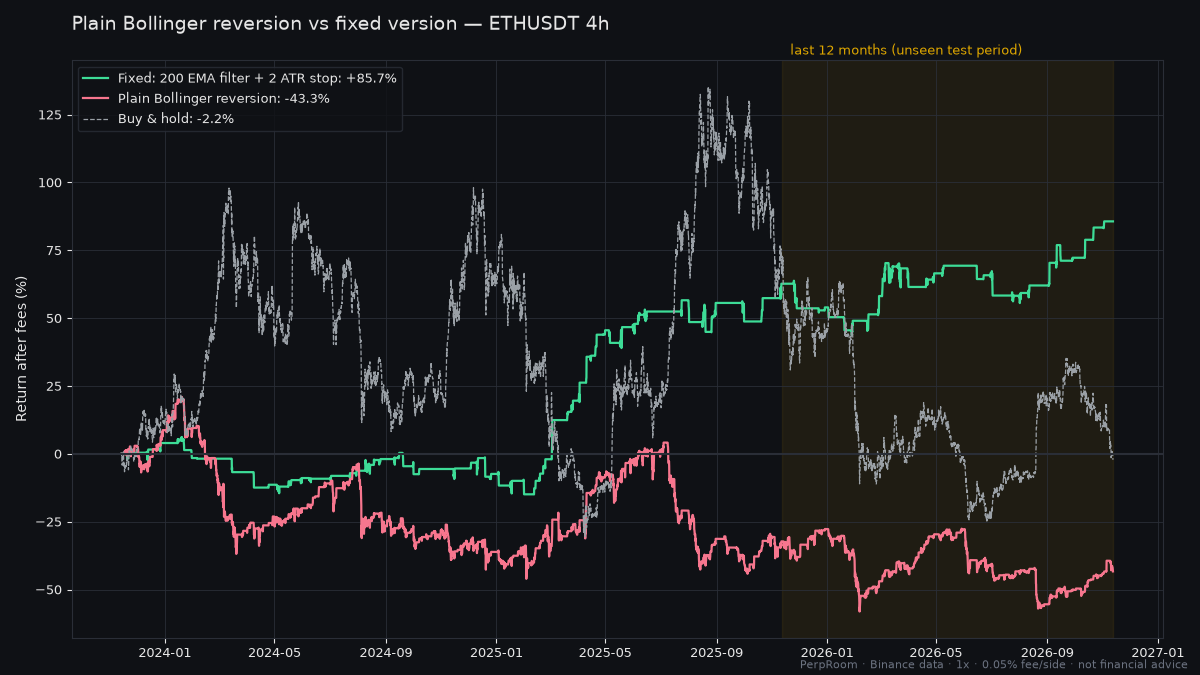
ETH is the cleanest example of the whole idea. Holding ETH for three years got you -2.2%. The fixed strategy made +85.7% on the same chart.
The unseen year
Here's the 4h part of the last twelve months, the data these rules were never judged on:
| Coin | Fixed: trades | Fixed: net | Fixed: max DD | Buy & hold |
|---|---|---|---|---|
| BTC | 33 | -0.2% | -13.9% | -29.2% |
| ETH | 31 | +14.1% | -12.2% | -41.0% |
| SOL | 34 | +30.7% | -11.6% | -46.6% |
BTC went flat. ETH and SOL kept working. In a year where holding any of the three lost between 29.2% and 46.6%, that's a solid result, and it's the part we trust most.
1h: still a fee furnace
On 1h the fixed version is far better than the plain one and still not worth running.
The plain version on 1h took close to a thousand trades per coin over three years. Fees alone came to 98.2% of capital on BTC, 99.9% on ETH and 96.9% on SOL. You were basically paying the exchange your whole account to lose money.
The fix cut trade count by about two thirds, which is great, but fees on 1h still ate between 31.6% and 33.6% of capital. Before fees, BTC 1h and ETH 1h were both up about 30%. After fees, both finished around -6%. Same signal, wrong timeframe.
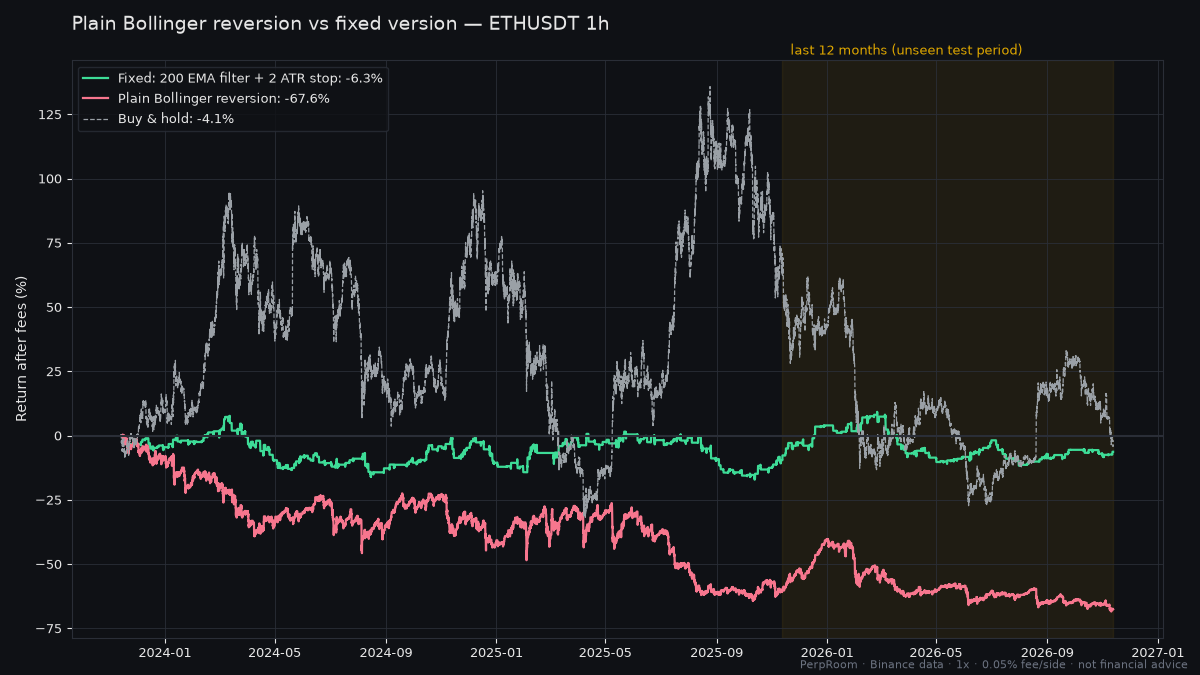
If you take one practical thing from this whole series, make it this one. On a strategy that trades a lot, the timeframe decides whether the fee bill eats your edge.
Why it works
Plain Bollinger reversion assumes price snaps back to the middle band. In a range it does. In a trend it doesn't, and the plain version keeps fading a move that just keeps going.
The 200 EMA filter changes the question. Instead of "is price stretched?", it asks "is price stretched against the trend?". A pullback to the lower band in an uptrend is a dip you want to buy. The same touch in a downtrend is a falling knife, and now you just don't take it.
The stop does the rest. When a dip turns into a breakdown, you're out at 2 ATR instead of riding it down to the middle band that never comes.
What we're not going to pretend
Three years, two regimes. A strong uptrend, then a hard downtrend. A long sideways grind could look different, and that's exactly where a trend filter tends to struggle.
94 to 98 trades per coin on 4h. That's enough to take seriously, not enough to call proven. A few big winners matter a lot at this sample size.
BTC was flat in the unseen year. One of the three 4h runs didn't make money in the period that counts most.
Real fills are worse. Stops here trigger on the candle close. Real stop orders fill on the wick, which can be better or a lot worse. No slippage and no funding either, and funding adds up when you hold shorts or longs for days on perps.
Leverage changes everything. At 1x the worst drawdown on 4h was -23.5%. At 5x that's an account-ending number.
Build it on TradingView
Paste into the Pine Editor, add it to a 4h BTC, ETH or SOL chart. Fees and close-based fills match our test.
📈 Paste this into the Pine Editor on TradingView: Open TradingView → Sign up through our link and get a $15 coupon toward a TradingView plan.
//@version=5
strategy("Bollinger reversion + 200 EMA + 2 ATR stop", overlay=true, process_orders_on_close=true,
     commission_type=strategy.commission.percent, commission_value=0.05,
     default_qty_type=strategy.percent_of_equity, default_qty_value=100)

[mid, upper, lower] = ta.bb(close, 20, 2)
trend = ta.ema(close, 200)
atr = ta.atr(14)
var float stopPx = na

if strategy.position_size == 0 and ta.crossover(close, lower) and close > trend
    strategy.entry("Long", strategy.long)
    stopPx := close - 2 * atr
if strategy.position_size == 0 and ta.crossunder(close, upper) and close < trend
    strategy.entry("Short", strategy.short)
    stopPx := close + 2 * atr

if strategy.position_size > 0 and (close >= mid or close <= stopPx)
    strategy.close("Long")
if strategy.position_size < 0 and (close <= mid or close >= stopPx)
    strategy.close("Short")

plot(mid, "Basis", color.gray)
plot(upper, "Upper", color.red)
plot(lower, "Lower", color.green)
plot(trend, "EMA 200", color.yellow)
Verdict
Of everything we've tested so far, this is the one we'd actually keep on a watchlist. Bollinger reversion with a 200 EMA filter and a 2 ATR stop, on 4h, made money on all three coins over three years and held up on ETH and SOL in the unseen year.
We'd run it on 4h only, at small size, with little or no leverage, and we'd expect live results to come in under the backtest once wicks, slippage and funding get their cut. What it isn't is a reason to stop thinking. It's a tool for buying dips in uptrends and shorting rips in downtrends without getting carried out on a stretcher when you're wrong.
FAQ
Do Bollinger Bands work for crypto trading? Plain mean reversion didn't in our test: it lost on all six coin and timeframe runs over three years. With a 200 EMA trend filter and a 2 ATR stop, it made money on all three coins on 4h.
What's the best timeframe for Bollinger Bands in crypto? 4h in our test. On 1h the fixed version was up before fees on BTC and ETH, but fees of 31.6% to 33.6% of capital pushed it into a loss.
Should I use a stop loss with Bollinger Band trades? In our test, yes. Without a stop, losing trades rode to the middle band however far away it was. A 2 ATR stop plus the trend filter took 4h max drawdowns from as deep as -65.4% down to the -20% range.