Supertrend Did Worse Than Just Holding in 5 of 6 Tests
The claim vs the data
Supertrend is sold as the clean trend-following indicator: ride the trend, flip when it turns, stay out of the noise. We ran the classic (10, 3) setup on BTC, ETH and SOL for one year of Binance data, fees included. It lost money in all six runs, and in five of them it lost more than simply holding the coin.
The rules we tested
- Indicator: Supertrend, ATR period 10, multiplier 3.0.
- Entry/exit: Go long when Supertrend flips bullish. Go short when it flips bearish. Every flip closes the current position and opens the opposite one, so the strategy is always in the market.
- Execution: Signal evaluated at candle close; position opened at that same close. No slippage modelled.
- Fees: 0.05% per side.
- Leverage: 1x.
- Data: Binance spot candles from the public market data API.
- Period: 2025-11-12 to 2026-11-12 (1.0 year). That is 8,759 bars on 1h and 2,189 bars on 4h.
- Markets: BTCUSDT, ETHUSDT, SOLUSDT on 1h and 4h.
Results
| Symbol | Timeframe | Trades | Win rate | Net return (after fees) | Return before fees | Max drawdown | Buy & hold |
|---|---|---|---|---|---|---|---|
| BTCUSDT | 1h | 220 | 36.8% | -31.7% | -14.8% | -41.5% | -29.0% |
| BTCUSDT | 4h | 60 | 33.3% | -40.4% | -36.6% | -49.5% | -28.0% |
| ETHUSDT | 1h | 216 | 31.0% | -46.9% | -34.0% | -57.4% | -41.3% |
| ETHUSDT | 4h | 58 | 29.3% | -35.4% | -31.4% | -52.6% | -40.6% |
| SOLUSDT | 1h | 226 | 33.6% | -53.8% | -42.0% | -59.7% | -47.7% |
| SOLUSDT | 4h | 56 | 26.8% | -59.3% | -56.9% | -70.1% | -46.1% |
Trade quality and costs:
| Symbol | Timeframe | Avg win | Avg loss | Profit factor | Fees paid (% of capital) | Sharpe |
|---|---|---|---|---|---|---|
| BTCUSDT | 1h | 2.33% | -1.57% | 0.87 | 22.0% | -0.66 |
| BTCUSDT | 4h | 4.4% | -3.3% | 0.67 | 6.0% | -1.02 |
| ETHUSDT | 1h | 3.94% | -2.05% | 0.86 | 21.6% | -0.79 |
| ETHUSDT | 4h | 8.11% | -4.08% | 0.82 | 5.8% | -0.47 |
| SOLUSDT | 1h | 3.93% | -2.35% | 0.85 | 22.6% | -0.89 |
| SOLUSDT | 4h | 9.6% | -5.23% | 0.67 | 5.6% | -1.12 |
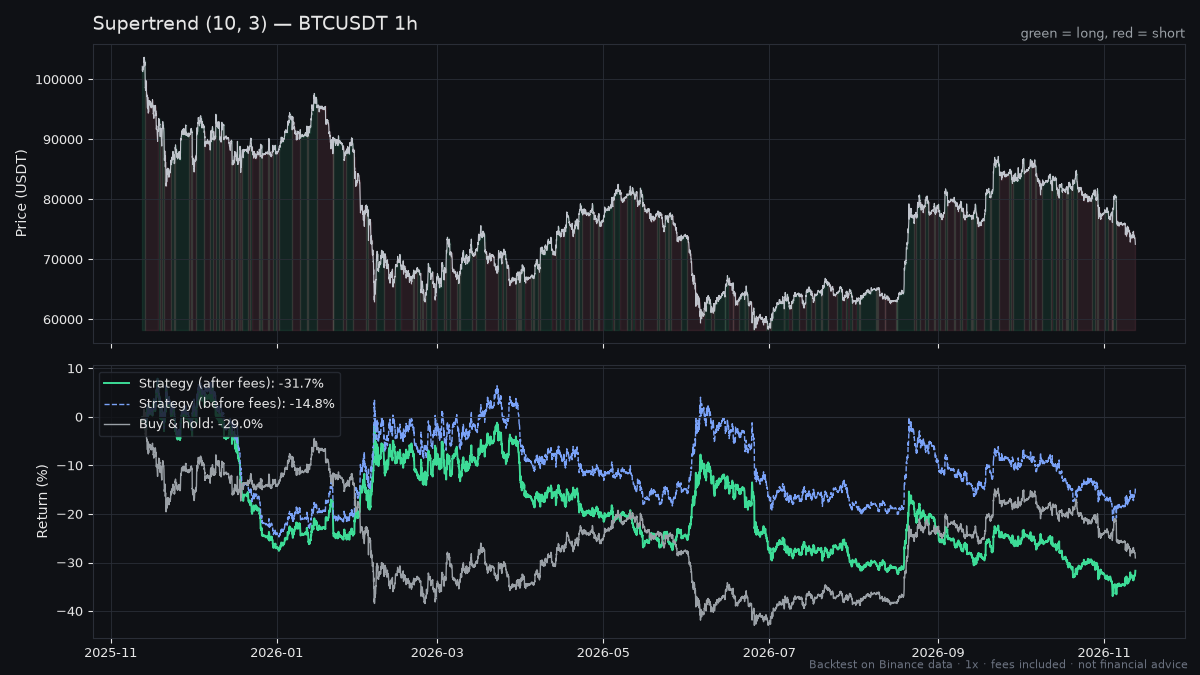
BTC 1h is the clearest picture of fee drag: a modest loss before costs became a much larger one after.
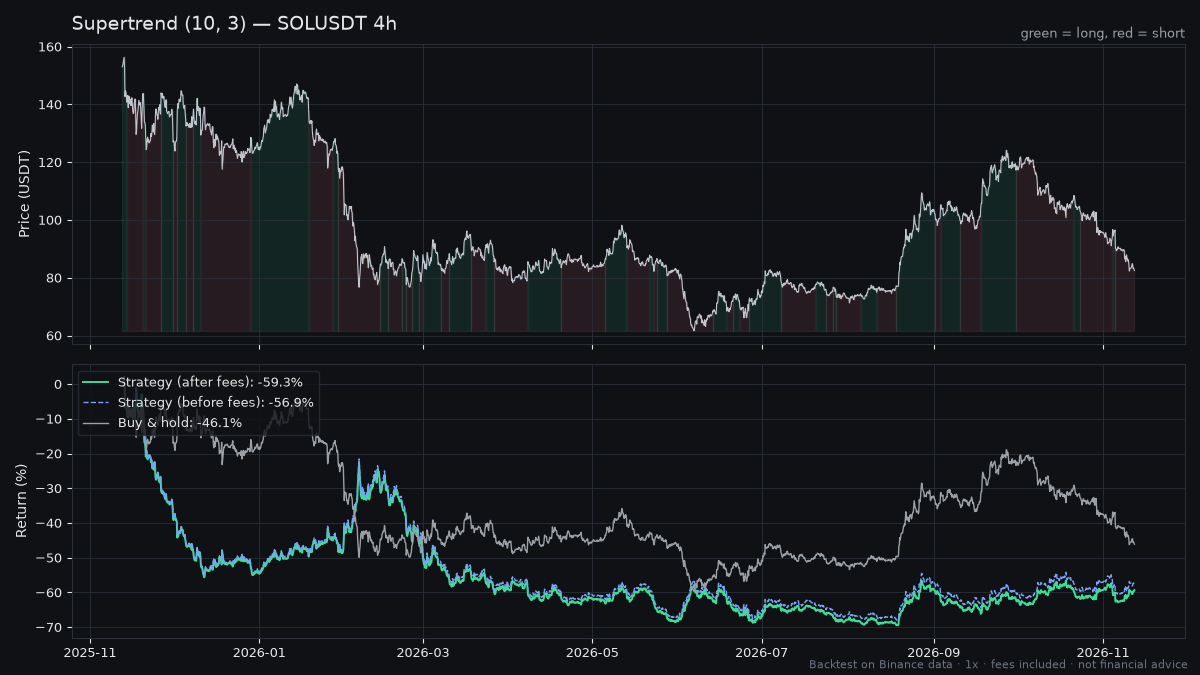
SOL 4h was the worst run: -59.3% net with a -70.1% max drawdown.
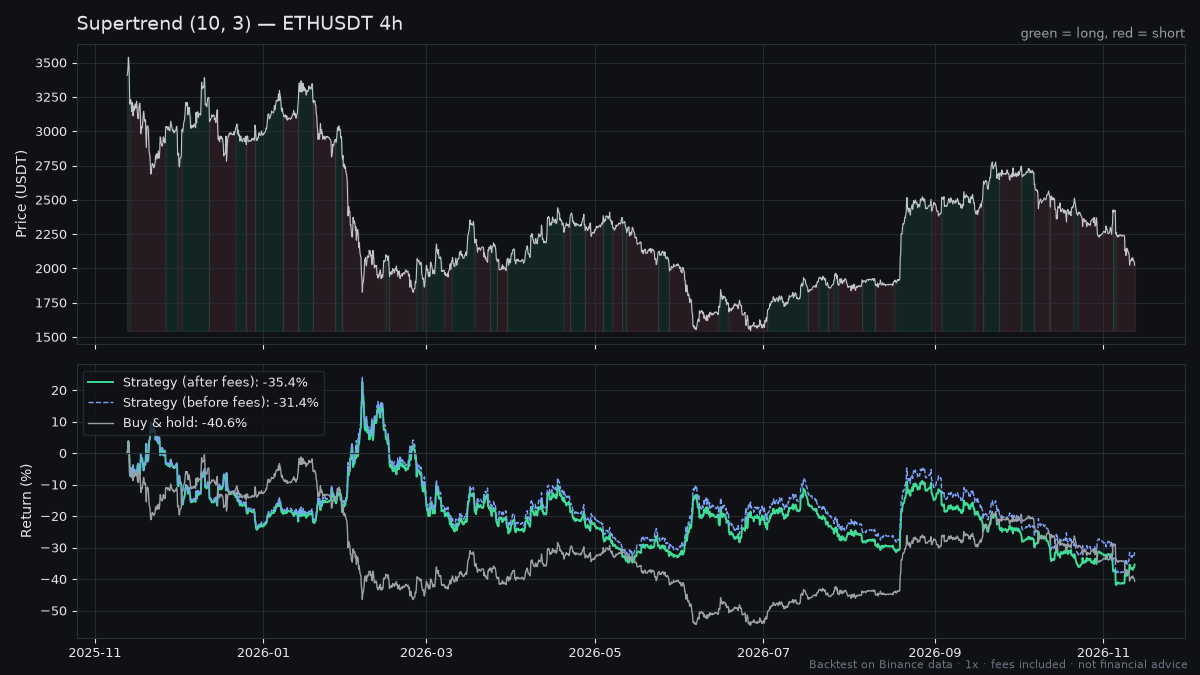
ETH 4h was the only run that finished ahead of buy and hold, and it still lost 35.4%.
What the numbers actually say
1. Low win rates are normal for trend following. The problem is the winners weren't big enough. Win rates ran from 26.8% to 36.8%. That alone isn't fatal: trend systems are supposed to lose often and win big. And the average win was larger than the average loss in every run. On SOL 4h, the average win was 9.6% against an average loss of -5.23%. But with only 26.8% of trades winning, that ratio wasn't close to enough. Profit factors sat between 0.67 and 0.87. Anything below 1.0 means the losers outweighed the winners.
2. Fees turned the 1h runs from bad to much worse. Each 1h run made 216 to 226 trades and paid 21.6% to 22.6% of capital in fees at just 0.05% per side. BTC 1h lost 14.8% before fees and 31.7% after, more than double. Here's the uncomfortable part: before fees, all three 1h runs actually lost less than buy and hold (BTC -14.8% vs -29.0%, ETH -34.0% vs -41.3%, SOL -42.0% vs -47.7%). Fees erased that. And this test models no slippage, which would only add cost.
3. A long/short system lost more than holding in a falling market. This was a down year: buy and hold lost between 28.0% and 47.7%. That's exactly the environment where a strategy that can short is supposed to earn its keep. Instead, Supertrend underperformed buy and hold in 5 of 6 runs. Only ETH 4h came out ahead (-35.4% vs -40.6%). The signals flipped often enough to get whipsawed on both sides instead of catching the decline.
4. Fewer trades didn't fix it. The 4h runs paid far less in fees (5.6% to 6.0% of capital), but on BTC and SOL they lost more before fees than the 1h runs did. BTC 4h was -36.6% before fees vs -14.8% on 1h; SOL 4h was -56.9% vs -42.0%. Slower signals cut costs but gave back more on entries and exits.
5. The drawdowns are severe at 1x. Max drawdowns ranged from -41.5% (BTC 1h) to -70.1% (SOL 4h). Sharpe ratios were negative everywhere, from -0.47 to -1.12. Leverage multiplies drawdowns too, so a leveraged version of this system would have been far more destructive.
How to test it yourself on TradingView
- Open a Binance spot chart for BTCUSDT, ETHUSDT or SOLUSDT and set the timeframe to 1h or 4h.
- In Indicators, search for Supertrend. TradingView ships a strategy version alongside the indicator; use the strategy so you get a Strategy Tester report. Set ATR length to 10 and the factor to 3.
- Make sure both long and short entries are enabled so the strategy flips and stays in the market.
- In the strategy Properties, set commission to 0.05% per order, order size to 100% of equity, and no pyramiding. Enable filling orders on bar close to match our execution assumption.
- Limit the test to 2025-11-12 through 2026-11-12 and compare net profit, max drawdown and number of trades against buy and hold.
- Expect small differences from our numbers due to data alignment and fill handling. The direction of the result is what matters.
Verdict
As an always-in, long/short system, Supertrend (10, 3) failed on every market and timeframe we tested over this year: all six runs lost money, five lost more than buy and hold, and drawdowns reached -70.1%. On 1h, the gross results were less bad than holding, but roughly 220 trades a year of fees wiped that out. If you want to keep using it, treat it as a component rather than a system: a trailing stop or trend filter, ideally on a slower timeframe where fees matter less, possibly combined with a filter that keeps you flat in choppy conditions. Any change like that needs its own backtest, ideally over more than one year, before you trust it. We haven't shown that any variant works.
FAQ
Does Supertrend work for crypto? Not as a standalone strategy in our test. Supertrend (10, 3) on BTC, ETH and SOL lost between 31.7% and 59.3% over 2025-11-12 to 2026-11-12, with fees of 0.05% per side, and underperformed buy and hold in 5 of 6 runs.
What are the best Supertrend settings? We tested only the common default, ATR period 10 and multiplier 3.0, so we can't name a best setting. Be wary of anyone who optimizes the parameters on one year of data: settings tuned to the past often fail out of sample.
Is Supertrend better on the 1h or 4h chart? Neither was profitable. The 4h runs made 56 to 60 trades and paid 5.6% to 6.0% of capital in fees, versus 21.6% to 22.6% on 1h. But on BTC and SOL, the 4h runs lost more even before fees, so lower costs didn't translate into better results.